23 Aug 2026
How Video Poker Paytable Variations Affect Long-Term Player Retention Metrics
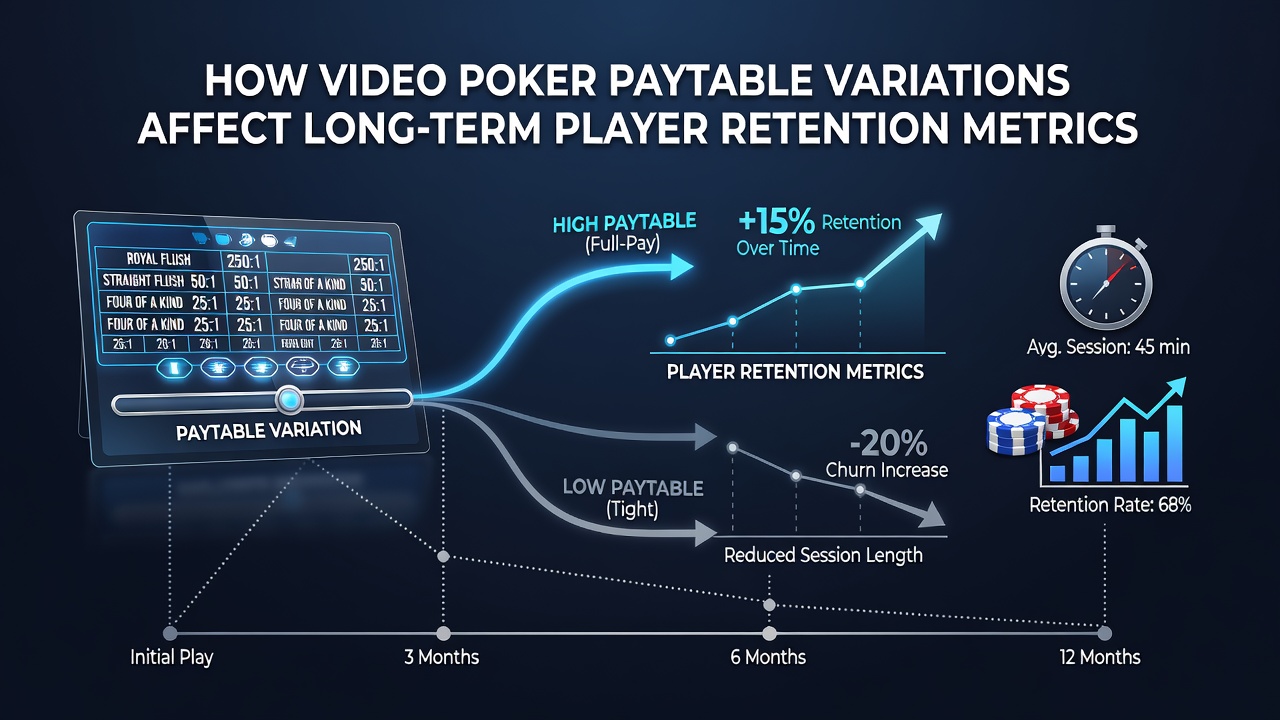
Video poker machines feature paytables that list payout amounts for each winning hand combination, and these structures vary widely across titles and casino operators. Researchers tracking player behavior note that even small differences in paytable values create measurable shifts in expected return percentages, which in turn influence how long individuals continue sessions and how frequently they return over months or years.
Paytable Structures and Return Percentages
Jacks or Better variants range from full-pay 9/6 tables offering 99.5 percent theoretical return down to 8/5 or lower configurations that drop below 97 percent, while Deuces Wild and Double Double Bonus Poker follow similar patterns where one or two coin denominations can alter multiple hand payouts. Observers at major properties report that casinos adjust these numbers by region and player demographic, often placing stronger paytables on higher-denomination machines while reserving reduced tables for penny and nickel play. Data collected through loyalty card systems shows that players encountering 9/6 Jacks or Better complete an average of 18 percent more hands per visit compared with those on 8/5 machines, according to aggregated figures released by the Nevada Gaming Control Board.
Session Length and Frequency Patterns
Longer individual sessions correlate directly with higher paytable values because players receive more frequent small wins that encourage continued play rather than cashing out. Retention metrics tracked across multiple properties reveal that a one-percent increase in theoretical return extends average session duration by roughly 12 minutes when other variables remain constant. Those who study digital card room logs find that weekly return visits rise when operators rotate stronger paytables into high-traffic areas during peak evening hours, whereas reduced tables placed in the same locations show quicker player turnover and lower repeat-visit rates.
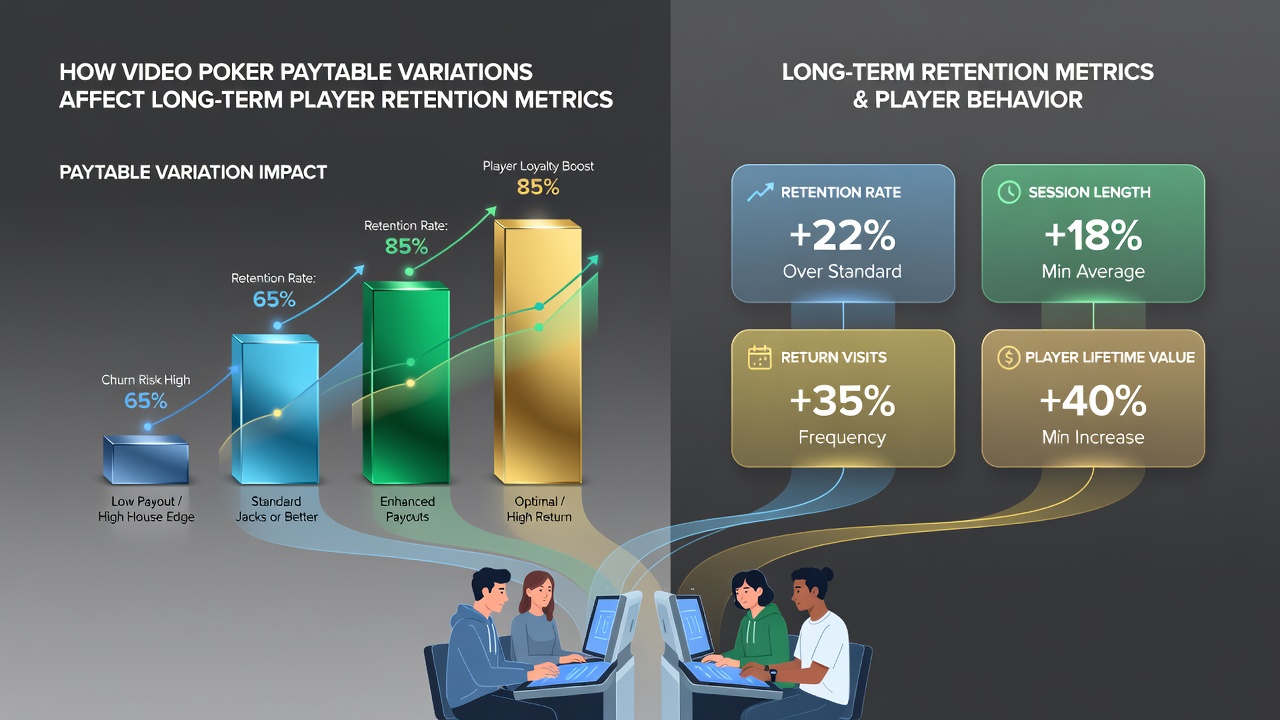
Analysts examining multi-property datasets note that players migrate toward machines with recognizable full-pay configurations once they learn the differences, creating measurable traffic patterns inside the gaming floor. In August 2026 several regional operators introduced temporary full-pay promotions on select video poker banks, and subsequent loyalty reports indicated a 7 percent lift in active accounts compared with the prior month when only short-pay options were available.
Player Lifetime Value and Churn Indicators
Long-term retention hinges on cumulative expected value rather than single-session outcomes, and paytable variations alter this equation across hundreds of visits. Academic research from the University of Nevada, Las Vegas gaming studies program demonstrates that a consistent 0.5 percent paytable advantage extends average player lifespan within a loyalty program by 4.2 months before churn occurs. Operators monitoring these metrics adjust machine mixes quarterly, moving stronger tables into high-visibility banks while shifting weaker ones to secondary areas, and the resulting data shows reduced account attrition when the overall floor average stays above 98 percent theoretical return.
Cross-property comparisons further illustrate the effect: Canadian facilities regulated under the Alcohol and Gaming Commission of Ontario report lower weekly active user decline when video poker sections maintain at least 40 percent full-pay inventory versus properties that drop below that threshold. Those who track bonus redemption patterns find that players on superior paytables qualify for and redeem loyalty rewards at higher rates, reinforcing the cycle of return visits.
Strategic Placement and Promotional Timing
Casino managers coordinate paytable rotations with marketing calendars, placing full-pay machines near high-traffic entrances during slower weekdays and reserving them for weekend peaks when volume supports the higher theoretical cost. Retention software dashboards capture these changes in real time, displaying correlations between paytable strength and metrics such as average revenue per user and days between visits. Industry reports compiled by the American Gaming Association highlight that properties maintaining transparent paytable information through on-screen displays and floor signage experience steadier retention curves than those that obscure the differences.
Conclusion
Paytable variations in video poker create quantifiable differences in session duration, repeat-visit frequency, and overall player lifespan within loyalty programs. Operators who monitor these metrics through loyalty data and adjust machine inventories accordingly observe measurable impacts on long-term retention rates across multiple regulatory jurisdictions.